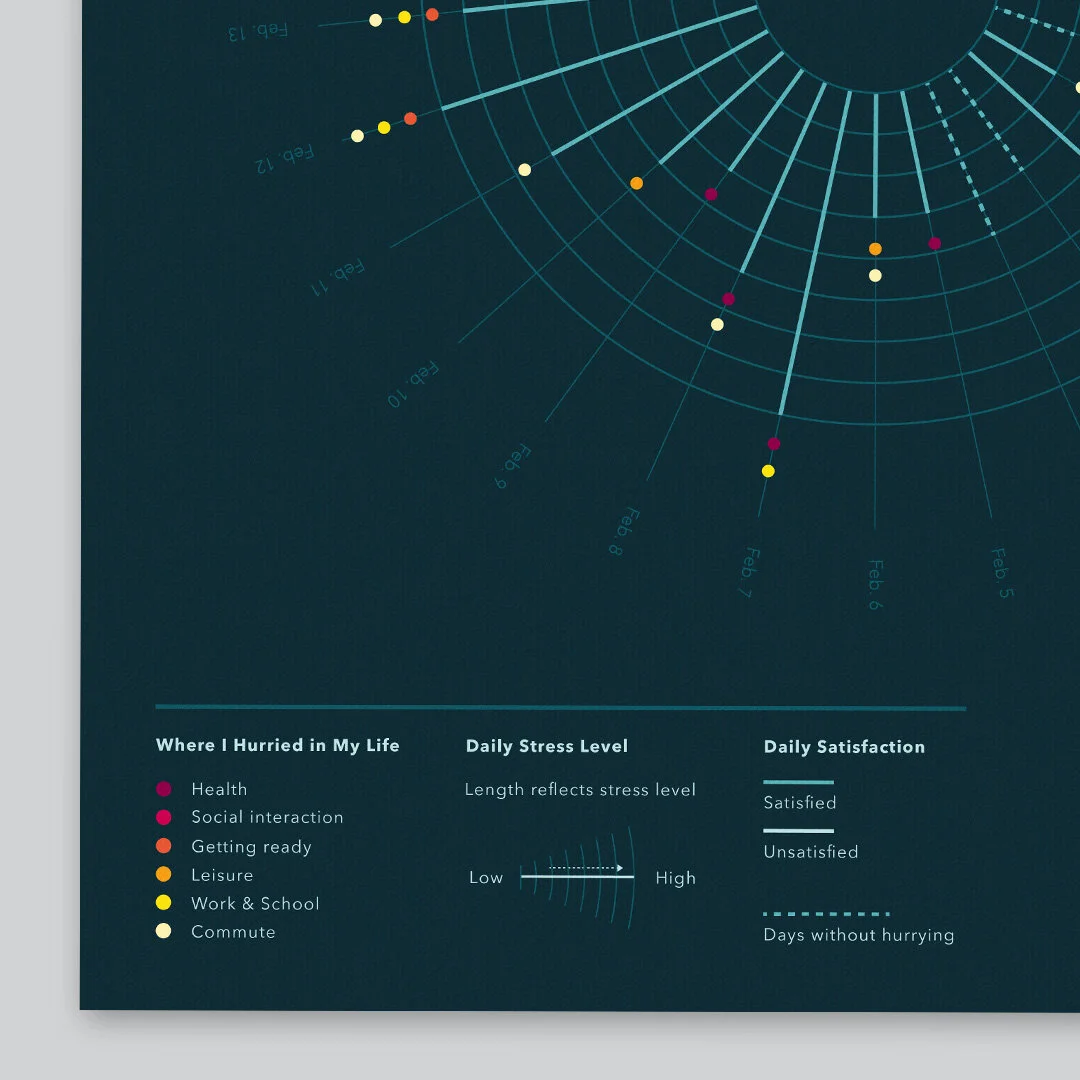
data visualization
Today, we have technology that is supposed to save us time. Time that we are supposed to use to share with family and friends. But do we? Over the course of a month, I kept a journal tracking my time. I made note of when I hurried, where I tried to save time, and why. The data presented shows how I was unsatisfied during slow days. These days my anxiety has increased and the pressure to be busy overpowered. Do you feel the same?


growth
skills
Research analysis
Hierarchy
Typography
learnings
Highlighting the significance of the data
Uncovering patterns, correlations, and trends
Tell a clear story
